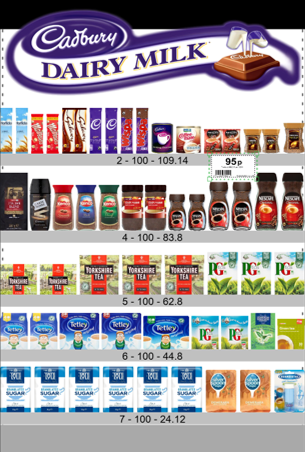
3D planograms all start with a 2D planogram
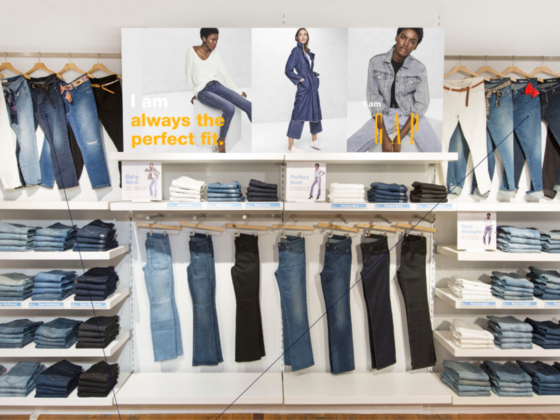
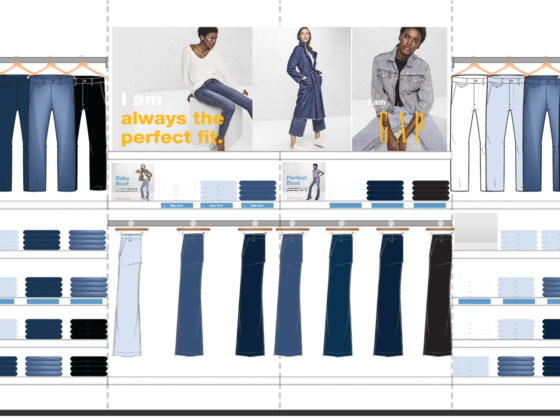
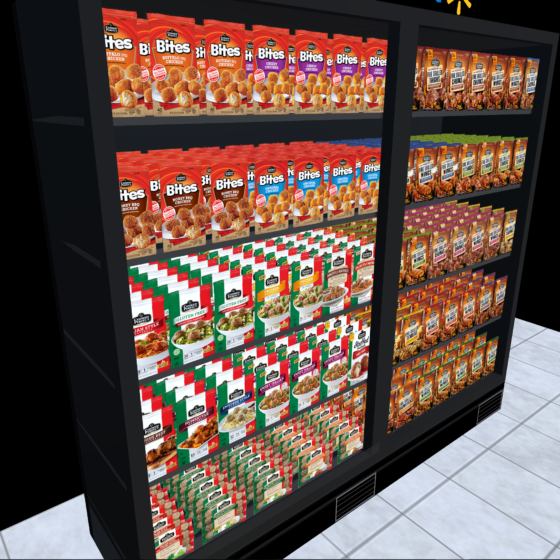
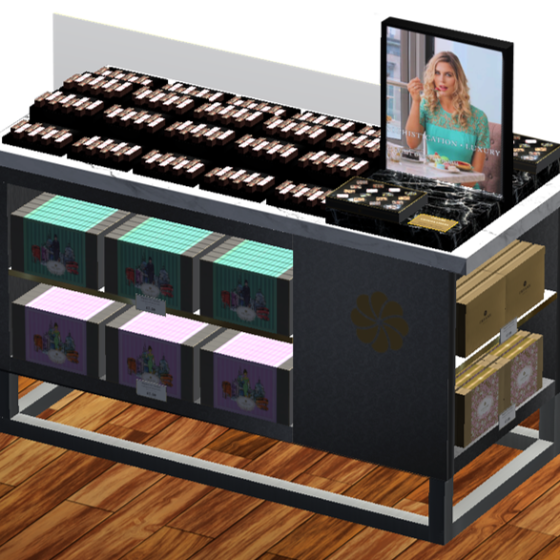
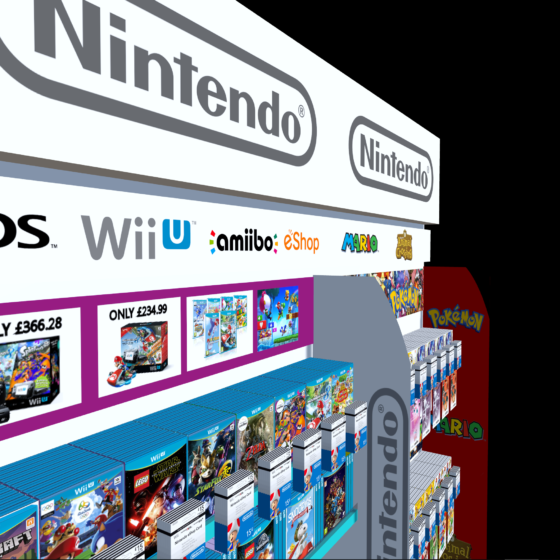
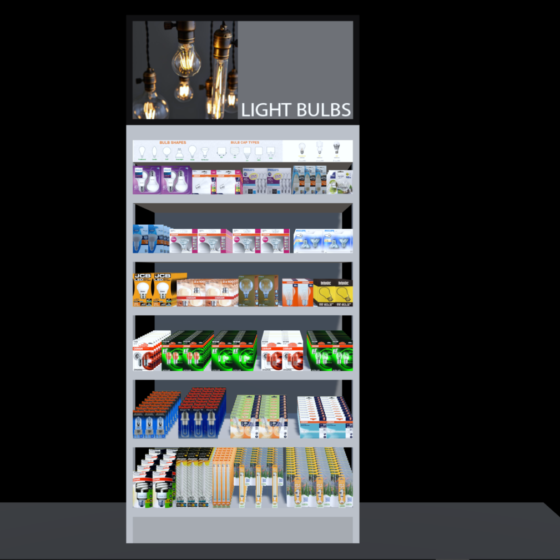
The creation of your 3D planogram design starts with the creation of a 2D planogram. Designing your 2D planogram in Scorpion is made easy thanks to its intuitive design, using the latest technologies and frequently used keystrokes. Examples of the easy use of Scorpion are drag and drop, click to resize, copy and paste of bays and shelves including their properties and resizing via your mouse. With Scorpion you can design most, if not all, fixture types including open shelves, pegboards, slot walls, blocks, table tops and freezer chests. When you have finished creating your 2D planogram, you are ready to immerse yourself into the Scorpion 3D environment. See below for an example of a 3D recreation of a part of a store in Scorpion 3D planogram software.
Instore Image
2D Planogram
3D Planogram
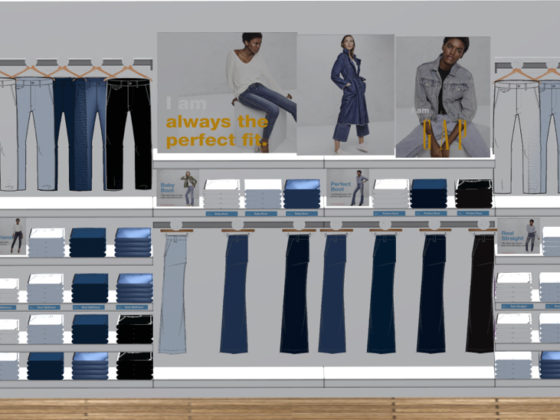
3D Planograms
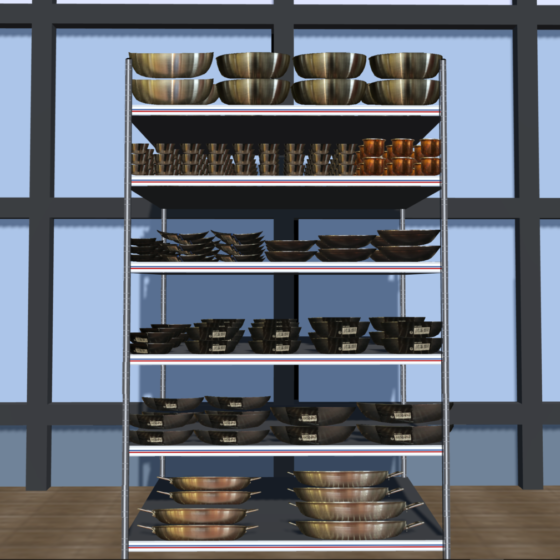
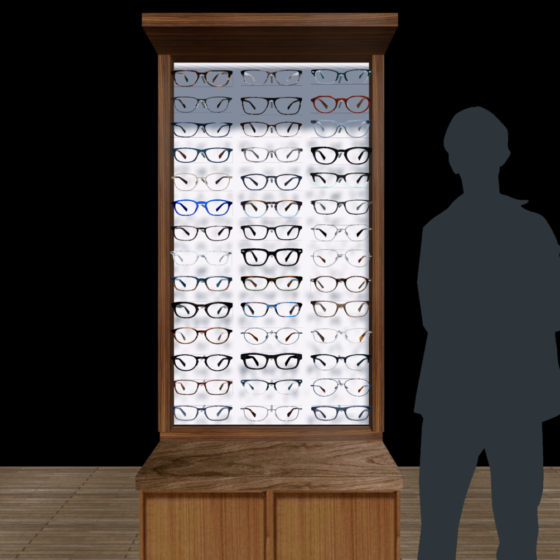
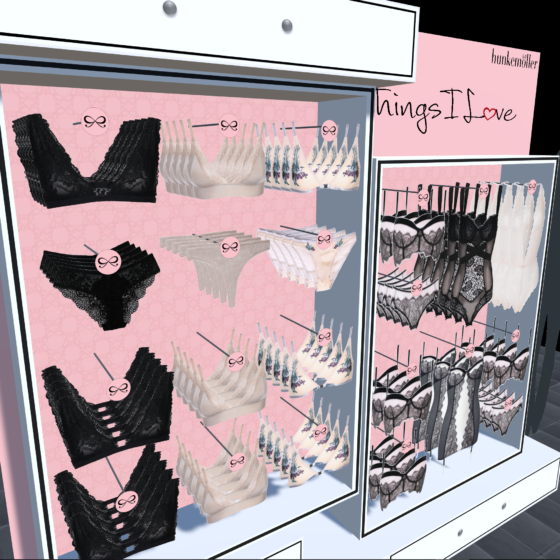
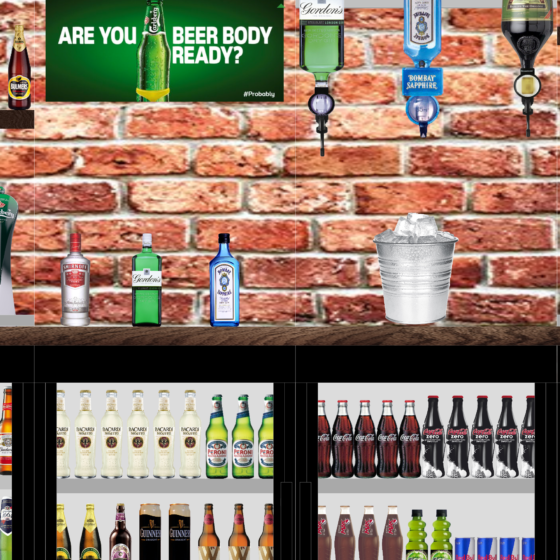
We make it easy for you to view what your customers see in store. You just switch on 3D in Scorpion Planogram to render your planogram in a virtual 3D planogram environment. In the 3D planogram environment, you can walk around your fixtures and view the fixtures from all angles and heights. The 3D planograms are perfect for signing off brand packaging concepts, sales presentations, viewing Point of Sale ideas and Free Standing Display Unit design concepts. A picture is worth a thousand words so please check out the visuals on this page or stroll through our planogram examples and templates in our gallery.
2D and 3D Planogram Outputs
Scorpion planogram software allows you to capture and print your 2D and 3D planogram designs to all common formats such as PDF, Excel and PNG. The printouts are fully customizable, so you decide which information is printed. You can choose from options such as printing product dimensions, bay and shelf numbers, and the fixture sales data. No more surprises when merchandising your products on your shelves, with Scorpion you are always sure that the products and shelves have the correct dimensions. Your 3D planograms can also be printed along with powerful insights into brand performance using reports charts, and onscreen highlights like hot spot analysis.
